I think I’m lucky. I get to talk to people about digital analytics almost every day. (Hey, it’s fun for me, ok?)
But over the years I’ve noticed something a bit silly.
Everyone’s always talking about how to measure more stuff and see more reports.
They need to capture every movement of every visitor.
They want to dip their fingers into a swirling ocean of numbers.
They’re desperate for a veritable avalanche of interactive charts straight off the set of Minority Report.
And it’s all a complete waste of time if you don’t know how to take the next step.
The most important work you will do in Analytics isn’t setting up traffic attribution or installing dashboards. It’s actually analysing your data.
And wow, can that be a daunting prospect! Where on earth do you start? What should you look at first? How do you know when something is important and what can you even do about it??
Luckily, there’s a simple place to start and it’s called segmentation. It’s the bread and butter of analysis, is super easy to learn and will make finding those important insights so much easier.
What is segmentation?
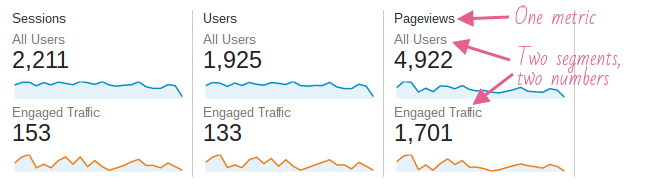
Segmentation is the most powerful way to observe and compare the behaviour and engagement of different types of visitors. It’s what happens when you look at any report that has more than one number for a single metric. In fact, it’s the only way to analyse!
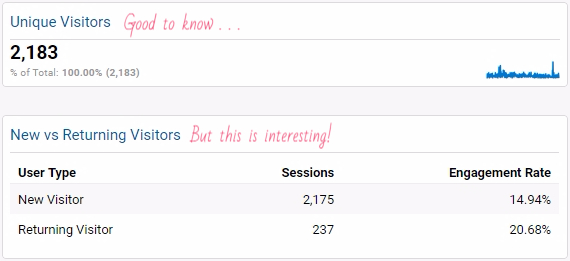
If you open Google Analytics and see this, what does it tell you?
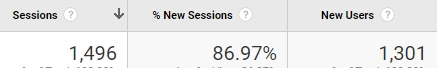
Not much. Those are simple site-wide metrics that encompass all of your varied visitors, coming from different places and looking at different listings. Is it good that you’re getting 87% first-time sessions? Who knows!
What if we add this to the report?
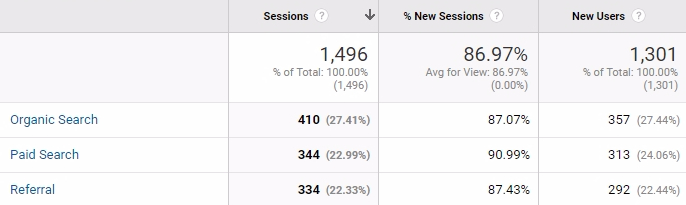
Those are just three regular rows of a standard Acquisition Channel report, but they’re also segments of those site-wide totals.
And they make it slightly more interesting. We’re getting a lot of visitors through our paid search ads, and they’re more likely to be new visitors. Nothing mind blowing yet, though.
Let’s add another segment…
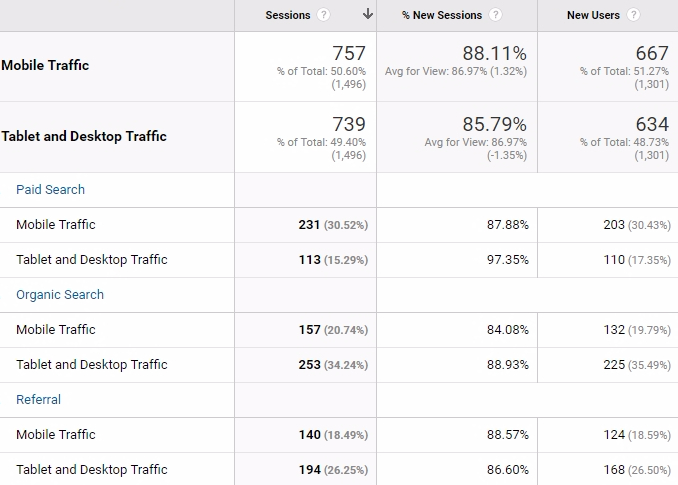
Now we’re combining two segments: the Acquisition Channel and visitor Device Category (whether or not they’re using a mobile phone).
These may not be the most riveting metrics to look at, but this report finally points me in a direction to investigate!
What’s going on with mobile visitors in my paid search ads? They make up the majority of those visitors and are slightly more likely to be returning visitors (which often means engagement and $$$!).
That was segmentation.
In just two steps, I found a clue to kickstart an investigation into something that might save or make me money: the performance of my search ads.
Why is segmentation so important?
Your visitors are made up of lots of different types of people, arriving at your shop from different places, in different circumstances. You shouldn’t measure how they’re behaving in simple totals & averages, all grouped together, because they’re not all the same!
Segments let you find out what to do next
If your bounce rate is up, you need to ask: who is bouncing the most? Are all my visitors bouncing more often? Is it just a certain type of visitor, those from a particular source, or on just one listing?
Segments let you see things that weren’t visible before
If your shop-wide bounce rate hasn’t really changed in two months, is that the whole story? Maybe there are changes going on that cancel each other out, so you can’t see them in the average! Segmentation lets you find out.
How to choose a segment
Know where to start
First, predetermine the kinds of metrics to look at. (Start with my dashboards for Etsy shop owners.) Knowing what data to look at before you open Analytics will save you lots of time and stress.
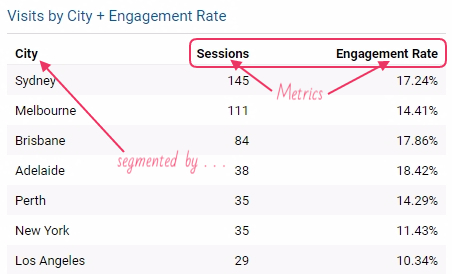
A lot of the time, this data will already be “segmented” by including dimensions. A list of your top cities, landing pages or traffic sources, showing the Sessions and Engagement Rate for each, is effectively segmenting your total Sessions and Engagement Rate metrics.
What else do you need to know?
To decide what extra segments might be useful, you can either:
- apply them randomly until you see something that seems interesting, or
- think about what could impact the metric, and start with those segments.
A good example is landing pages.
I could segment my landing page performance report by looking at Male & Female visitors, or Engaged Visitors. But is the gender of my visitor likely to impact the performance of any particular landing page? Is it relevant to show Engaged Visitors when they only become engaged later in the visit (3 pages and 180 seconds in, to be exact)?
So what’s more likely to impact how a landing page performs? How about…
- Mobile visitors. Do the images, title and description work well on small screens?
- Traffic source. Are visitors from certain sources dropping off because the landing page isn’t right for that link or promotion?

Of course, if you have no idea how to break the numbers down, applying random segments is totally ok! Just make sure that you understand what the segment really shows, so you know how to interpret the results you get.
(And keep reading to get some ideas for good segments for Etsy!)
How to apply segments to Google Analytics
“Segmentation” means different things to different people. I’ve used it to describe any way that you break down numbers to see more detail about what’s really making up that total. And that’s a perfectly fine definition, because it’s really important that you do that, no matter what technique you use!
Here are three ways to apply segments, including the way most people think when you say “segmentation”.
1. Look at dimensions
Site-wide numbers are boring and misleading. Adding dimensions to anything makes them better!
I include a few “overview” metrics in my dashboard, but they’re just that: an overview. You can’t analyse them.
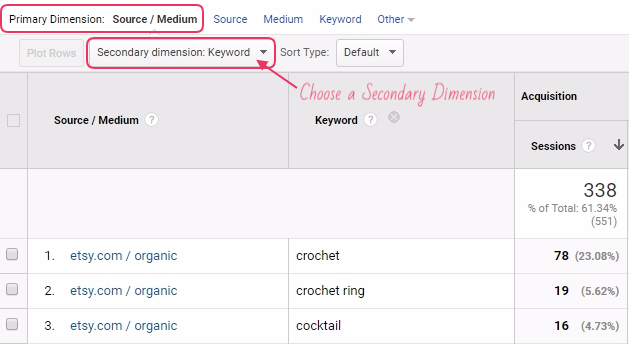
2. Add a secondary dimension
Almost every standard report in Google Analytics can have a secondary dimension. It just creates a new row for each unique combination of the primary and secondary dimensions (segmenting the primary dimension even further!).
3. Apply a Google Analytics Segment
A “Segment” in Google Analytics is actually a special feature. When you apply a Segment like this, all your reports will now show values for each of the visitor groups you’ve chosen.
If you’ve set up your Engagement Goals, then you should know how to do this!
Get the most up to date instructions for Segments from Google’s Analytics Help.
(Skip down to the heading “Apply Segments”.)
This type of segment is really powerful!
They’re most useful for when you want to look at a few different reports using only a sub-set of your visitors, or comparing two or more groups. For example, you could have a segment that only shows visitors from the countries you ship to. (Few people outside of these countries are potential customers, so you can often ignore them!)
They’re also vital when the segment you want to investigate isn’t just a simple Dimension. In the example above, the “Engaged Visitor” segment actually shows any visit that included more than 3 pages and lasted longer than 180 seconds. The Segments feature is the only way to create this group to analyse.
Useful segments for Etsy shops
So if you have no idea where to start segmenting your data, choose one of these ideas! Some can just be used as Dimensions. Others are best suited to the Segments tool.
Who are they?
- Male & Female visitors
- Age brackets
- State or city
- Create a segment for your target audience!
- Visitors from the countries you ship to.
- New or returning visitors (“Visitor Type”)
- Mobile visitors (“Device Category”)
Where are they coming from?
- “Source/Medium” dimension
- Etsy Organic vs Etsy Referral
- Etsy search terms (chunk into groups of similar terms)
- Social networks
- Advertising campaigns
- Referral sites
What are they doing?
- Landing pages (use the “Product Page” Content Grouping or your Listing Simple Name)
- Whether they’re an “engaged” visitor
- Visitors who bounced vs did not bounce
As usual, let me know… what did applying segments let you learn about your visitors and your shop?
Comments (1)
How easily I am confused by numbers! I never really feel like I “get it”. It’s not my strong suit but I absolutely know how important it is.