In June 2021, Etsy stopped running our Google Analytics tracking code on our shop home pages. (Our listings are still tracked normally.)
This might sound like a big deal but let’s look at the effects in some detail before worrying too much.
First of all, it’s been well over 6 months at the time you are reading this. So if you haven’t noticed anything unusual in your reports yet, that’s a pretty good sign that you aren’t being impacted.
This does not mean that your numbers haven’t changed at all! Your visitors were (and still are) viewing your shop home. And now those views are not tracked in Google Analytics. That’s a fact.
The question is whether the impact of these views disappearing is visible in your reports or if it’s been buried by other effects & changes over the past months or year? Are the trends you saw this year actually a result of this tracking change or other things going on with your marketing and buyer behaviour?
Luckily for you, I have crunched the numbers – looking at Google Analytics reports for five different Etsy shops – and the answer is:
There is (probably, most likely) no or minimal noticeable impact on your reports!
Wonderful! Relax and carry on as you were!
If you want to learn more, keep reading to understand more about what impact this change could have and how I came to my no-stress conclusion. Along the way, you’ll get an insight into the thinking behind a real-life analysis.
This article references GA Universal Analytics, which is no longer available. Etsy now supports GA4.
What has happened?
Views of our Etsy shop home are no longer tracked in Google Analytics
Your Etsy shop “home” is just one page, but it contains your shop announcement, complete item catalogue (including each separate Section), and your Reviews, About and Policies. There is a lot for visitors to do here, so it’s fair to wonder if we’re missing anything important by these views now being invisible to us in Google Analytics!

Nothing else has changed. Your listings are still tracked normally.
So what kind of effect has this change had on your reports?
How could this change your Google Analytics reports?
We know what’s happening: a page in our shop (home page) is no longer tracked in Google Analytics.
Our challenge now is to ask the right questions of our data to be able to observe the results of this change and figure out if they’re actually visible. This will help us identify the impact when we see it and not attribute it to something else and think we did something wrong (for example).
Why might the impact be invisible in our reports?
This single change to our Google Analytics tracking is not the only change that’s been going on in our shops. Time has moved on and seasons have changed. This year is different to last. Old customers have stopped visiting and new ones have discovered your shop. You might have changed your marketing or even your products!
All of these things will also impact your numbers – and could override any impact from the tracking change, rendering it invisible.
How could this be?
Imagine starting a new hobby.
There are lots of different ways you can learn and improve your technique. You could:
- Watch 100 hours of video
- Invest in high quality tools and materials
- And – of course – practice, practice, practice
A few months later, you’re really happy with what you’re producing! But how much of your improvement can be attributed to each of those steps?
What if you still use beginner-level, budget materials but worked on your technique every single day? Can you tell how much better you’d be if you’d bought the good stuff straight away? Can you put a number on it?
You can guess, but all of these steps – these “levers of change” – impact the same “hobby metrics”: the quality of your work and confidence in your technique. The results of each are blended together.
It’s the same with things that might change your shop metrics. To tease apart the effect of different changes means thinking hard about very specific questions to ask our data.
What effects might we see from our shop home page not being tracked?
Page views
No views of our shop home are tracked, which will mean that all “page view related” metrics will be impacted! This could result in:
- Fewer total
Page Views - Lower average
Pages per Session - Lower average visitor
Engagement Rate(which uses Pages per Session in its calculation) - Higher
Bounce RatesandExit Rateson listings (where the visitor has actually gone to the shop home first before leaving)
Sessions
Visitors who arrive via our shop home are not tracked until (and if) they view an individual listing. This could result in:
- Fewer total
Sessionsbecause bounces from the shop home are not recorded at all - Fewer sessions attributed to Etsy traffic sources (in
Source / Medium) because we cannot read therefvalue on the landing page if it was the shop home – bypassing our filters - An increase in
(direct) / (none)traffic, as this is the most common traffic source that internal Etsy traffic returns if it cannot be re-attributed with our filters
Testing
This change has been a “gotcha” for sellers installing Google Analytics for the first time. You can no longer test your connection by viewing your shop home – it must be a listing page for any traffic to appear in your Real Time Reports!
What’s actually likely?
All of the impacts I’ve listed above are true. They are happening in your data as a result of of this change.
The questions to ask are:
- How much impact is there
- Can I see this impact underneath everything else?
- Should I change how I use Google Analytics as a result?
Basically: do I need to worry about this at all?
My investigation
I looked at Google Analytics reports from five different Etsy shops to see what impact The Change (tracking removal from shop home pages) had on overall reports. Starting with the changes I predicted above, I formulated specific questions and then built reports to investigate.
Page Views and Sessions (overall)
If Page Views and Sessions reduced in a report only because of this change (which is what we’re worried about), then we should be able to predict the reduction based on what we were seeing before the change:
- The number of shop home page views
- The proportion (%) of all page views that were of the shop home
- The number of bouncing sessions that started on the shop home
- The proportion (%) of all sessions that bounced from the shop home
So what did I actually see happen?
Before the tracking change:
- Shop home views contributed anywhere between 8% to 20% of all page views.
- Sessions starting on shop home contributed between 2.5% to 16% of all sessions.

However, both of these metrics are naturally very volatile! No shops showed a reduction in page views that matched their previous home page views. Only two showed a reduction in sessions that matched their previous shop home landing pages. Other factors were therefore generally contributing more than the effect of this change.
Trend graphs also highlighted that volatility and showed that even where sessions did decrease over the rest of 2021, that decrease was not consistent and fluctuated over the six month period, suggesting it could still have been caused by other things.
Visitor behaviour
If an entire page was removed from the tracking of every visit, we’d expect this to impact the metrics that depend on this. If the impact is visible, I’d predict:
- Reductions to
Pages per Sessionand our customEngagement Rate(because at least one fewer page is counted per session when the visitor views the shop home during a visit) - Increases to
Bounce RateandExit Rateacross product pages (because going from a listing to the shop home now means “leaving the shop” in GA if the visitor does not return to another listing)
Did I see what I predicted?
Across the shops I sampled (5), I saw all types of trends!
- Some did see reductions in Pages / Session and Engagement Rate. Others were stable or even increased!
- Of those that saw reductions (3), most (2) had a similar trend in the second half of 2020 so it was not unusual.
- Bounce and Exit Rates were also evenly split between predicted (up), down and stable.
Like above, these metrics are also quite volatile. Upward averages and trends did not mean a consistent, easy-to-attribute shift. It looked like this:

Segmenting by traffic source
I wanted to know: What traffic sources were previously sending traffic to the shop home, what proportion of that was internal Etsy traffic, and can we see where those visits are now being attributed?
I predicted:
- Fewer sessions attributed to Etsy traffic sources (in
Source / Medium) because we cannot read therefvalue on the landing page if it was the shop home – bypassing our filters - An increase in
(direct) / (none)traffic, as this is the most common traffic source that internal Etsy traffic returns if it cannot be re-attributed with our filters
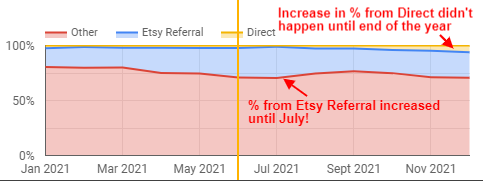
These were the most surprising results! Almost NO shop clearly showed the trends I predicted. Any percentage changes in how Etsy Referral and Direct traffic contributed to overall sessions was almost invisible.
Well configured GA accounts for Etsy shops have only a small amount of Direct traffic and this change did not noticeably increase it in any consistent way for the shops I reviewed.
Likewise, internal “Etsy Referral” traffic (from users’ home pages, favorites, Editors pick pages etc) is not a huge source of visits either. The loss of Etsy Referral traffic to shop home pages wasn’t noticeable in my investigation reports either.
Coming to a conclusion
If you’ve read along so far, you might be thinking something like…
This is all a bit vague. Every shop has had completely different results! Are you saying there IS or ISN’T an impact!?!
And you’d be right. It is vague and every shop did see very different results and trends.
But that’s how I’ve come to my conclusion:
If I couldn’t see the same clear trend in these shops’ reports based on my predictions, then it is unlikely to exist in yours.
As I said at the start: The Change has happened to your numbers; that’s undeniable. The question is whether it matters. Whether you can see it.
And from the reports I’ve looked at, it’s clear that other things (including the natural volatility of buyer behaviour, seasons or changes in your shop) have tended to way overpower any impact from the removal of shop home pages from Google Analytics.
So my suggestion, without having seen your reports (of course – this is not personal advice), is relax. Keep my hypotheses from above in mind if you’re doing year-on-year comparisons during 2022 and watch out in case you DO see any of these changes I predicted. But in general:
- Keep focusing on trends
- Predict and monitor the results of what you control (your products and your marketing)
Easy 🙂
Bonus question!
Does this mean we should be going back to Etsy Shop Stats to get total visit numbers now?
Honestly, I still can’t recommend using Etsy Shop Stats for visit numbers. Their definitions of visit vs view and where each metric is used in their reports has never been clear after the 2017 updates, and they still include too many bot visits for their totals to be any more accurate than Google Analytics is now. It’s not a simple matter of saying “The Visits Etsy reports are what my GA Sessions would have been.”
It really comes back to trends and using your analytics tools (either one) to show you how things change regardless of what the raw numbers say!