I bet you’ve been holding your breath for this one… Here it is:
The best starting reports + what to pay attention to so you don’t get lost!
Reminder: These are GA Universal Analytics reports and will not apply to GA4. Some have an equivalent and some others might come as GA4 gets more features, but most will need to be created yourself via the Exploration section (or might not actually be available anymore).
Here’s a quick list of them in case you want to get right in and check them out:
- Audience > Demographics > (all reports)
- Audience > Interests > (all reports)
- Audience > Geo > Location
- Audience > Behavior > New vs Returning
- Audience > Mobile > Overview
- Acquisition > All Traffic > Source/Medium
- Acquisition > Social > Network Referrals
- Behavior > Site Content > All pages
- Behavior > Site Content > Landing pages
- Conversions > Ecommerce > Overview
Audience
Audience data applies to individual people. Use these reports when you want to learn things about your visitors and customers as a whole.
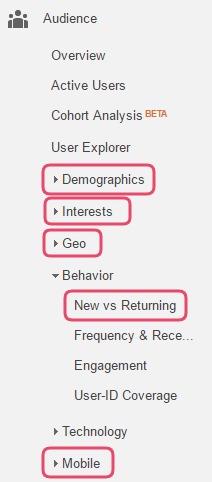
If you turned on Demographic reporting on day one, you can now access the reports under Demographics and Interests. Use this information to get a better picture of who’s really visiting your shop (Sessions) and whether it’s working for them (Bounce rate, Avg. Session Duration, Pages / Session). First, find out more about where that demographics data comes from.
The Geo > Location report is great to uncover any places where you’re unexpectedly popular or to confirm your audience. Are your visitors coming from affluent areas? Are you getting lots of interest from places you don’t ship to? You can change this report to show Countries all the way down to Cities, but note that Cities identified are not always accurate in every country.
Behavior > New vs Returning lets you very quickly detect any differences between between how people behave the first and subsequent times they visit. Try to increase your percentage of “returning” visitors… you’ll notice they perform better in all the “behavior” metrics: Bounce rate, Avg. Session Duration, Pages / Session.
Finally, have a look at your Mobile > Overview report. Are you still getting a lot of visitors using their mobile phones? Are your images clear enough to be viewed on small screens and small enough to download fast? Are your descriptions succinct? Check your mobile percentage!
Acquisition
Acquisition data is all about how visitors arrived at your shop.
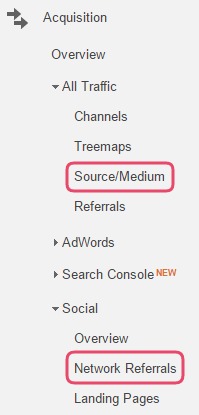
Acquisition > All Traffic > Source/Medium
This report is a great starting point for analysing how different marketing channels perform. Have a look at how many visits you get from each and how that changes over time or when you promote your shop. How do the “behavior” metrics compare between traffic sources?
Etsy sellers – make sure you have fixed your traffic sources before diving into this one!
Acquisition > Social > Network Referrals
Despite the technical-sounding name, this report just lists all the social media channels you’ve received traffic from. Right now, go straight to this report rather than the Overview, because this is where all your real data is.
Behavior
“Behavior” is what your visitors do in your shop, which will be mainly around viewing and showing interest in your products.
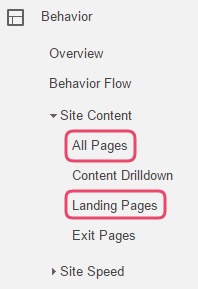
Behavior > Site Content > All pages
This report will list every page in your shop, using every different possible URL that people have accessed them with! If you sell on Etsy, it can be overwhelming and difficult to simply compare listings, so make sure you’ve grouped them correctly.
Behavior > Site Content > Landing pages
Landing pages are the first page that someone views in a single visit. All of your pages are equally likely to be used as landing pages because each item can be promoted individually. Use this report to see whether some listings get more “entrances” than others and how they perform (Bounce Rate).
Conversions
These reports can contain the most important information (like sales!!) but are also some of the hardest to configure. That’s why I’m only mentioning one report, which will be available to you if your ecommerce platform supports Google Analytics Ecommerce Tracking. If you have Shopify, Squarespace or any tool that gives you “your own website”, this is probably you.
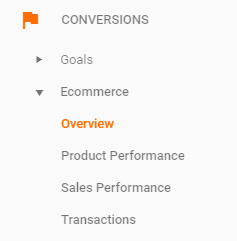
Conversions > Ecommerce > Overview
Watch your sales conversion rate, total revenue and average order value, plus get quick access to how individual products are selling.
Your Ecommerce Conversion Rate is what percentage of all your visitors have made a purchase. Expect this to be between 1 – 3%.
Average order value tells you how much each individual checkout is worth. Encourage your customers to buy more at once to increase your revenue for less marketing effort!
Is that it? Isn’t there a whole lot more?
Of course there is! How I’ve suggested to use these reports is just the tip of the iceberg, but I’m a big believer in learning how to do one thing properly rather than glossing over everything.
I think you’ll learn more about Google Analytics by sticking to two or three of your favourite reports and mastering them over time. Watch how things change and how your shop promotions affect your numbers (or don’t!).