Left it to the last minute to save your Etsy shop’s old Google Analytics data?
If you’re here, then yes: you have. The countdown is on to 1 July 2024 when all our Universal Analytics data will be deleted!
Don’t worry, I’ve left it this late too… Let’s do this together 🙂
In true Artisan Analytics fashion, I have created a custom Google Sheet that will automatically backup the most relevant and important Google Universal Analytics data for an Etsy shop and I am releasing it here for free.
Quickstart Guide
- Install the official Google Analytics for Google Sheets add-on
- Make a copy of the Google Sheets backup tool
- Complete the “Settings” tab with information about the Universal Analytics View you need to backup
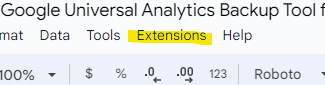
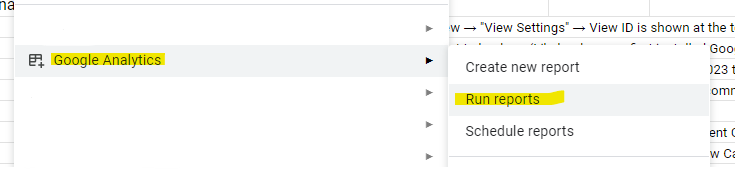
- Go to Extensions → Google Analytics → Run reports
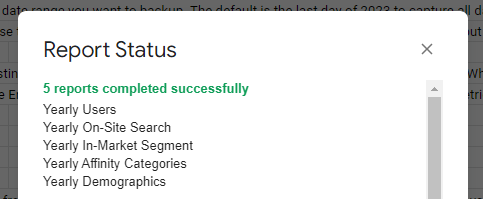
- If all reports run successfully (there’s a confirmation pop up), you are done 🎉
The backed-up data now lives inside this Google Sheet, in your Google Drive account, for as long as you keep it there. You can do whatever you want with it, like view it in a Google Looker dashboard.
What data does the tool backup?
This backup tool does not save 100% of the data in your Google Analytics account.
It can’t. There is a LOT of tiny pieces of data in there and that would be one absolute behemoth of a spreadsheet if we tried.
You also won’t need that much detail! The data you’re backing up is at least 12 months old by now. You aren’t using it to make crucial in-the-moment business decisions on the fly. You’ll be using it to conduct year-on-year comparisons and long term trend analyses. “High level” is perfect.
I have developed a set of basic reports that cover 95% of the information that 95% of Etsy shops will need to know from their historical Google Analytics data, based on what I have recommended in my “Google Analytics for Etsy” ebook over the years.
Here’s what it covers:
Basic traffic numbers & sources
- How many visits did I get on x date?
- Show me the monthly traffic trends comparing 2 years?
- Traffic and engagement rates from each marketing source & campaign
- Traffic and engagement rates from each country
Listing, search & interest topic history
- What was my most popular product in 2021?
- Traffic to each listing per month
- A summary of ALL search terms used to find my shop over the years
- A summary of the interest / in-market categories Google applied to my visitors over the years
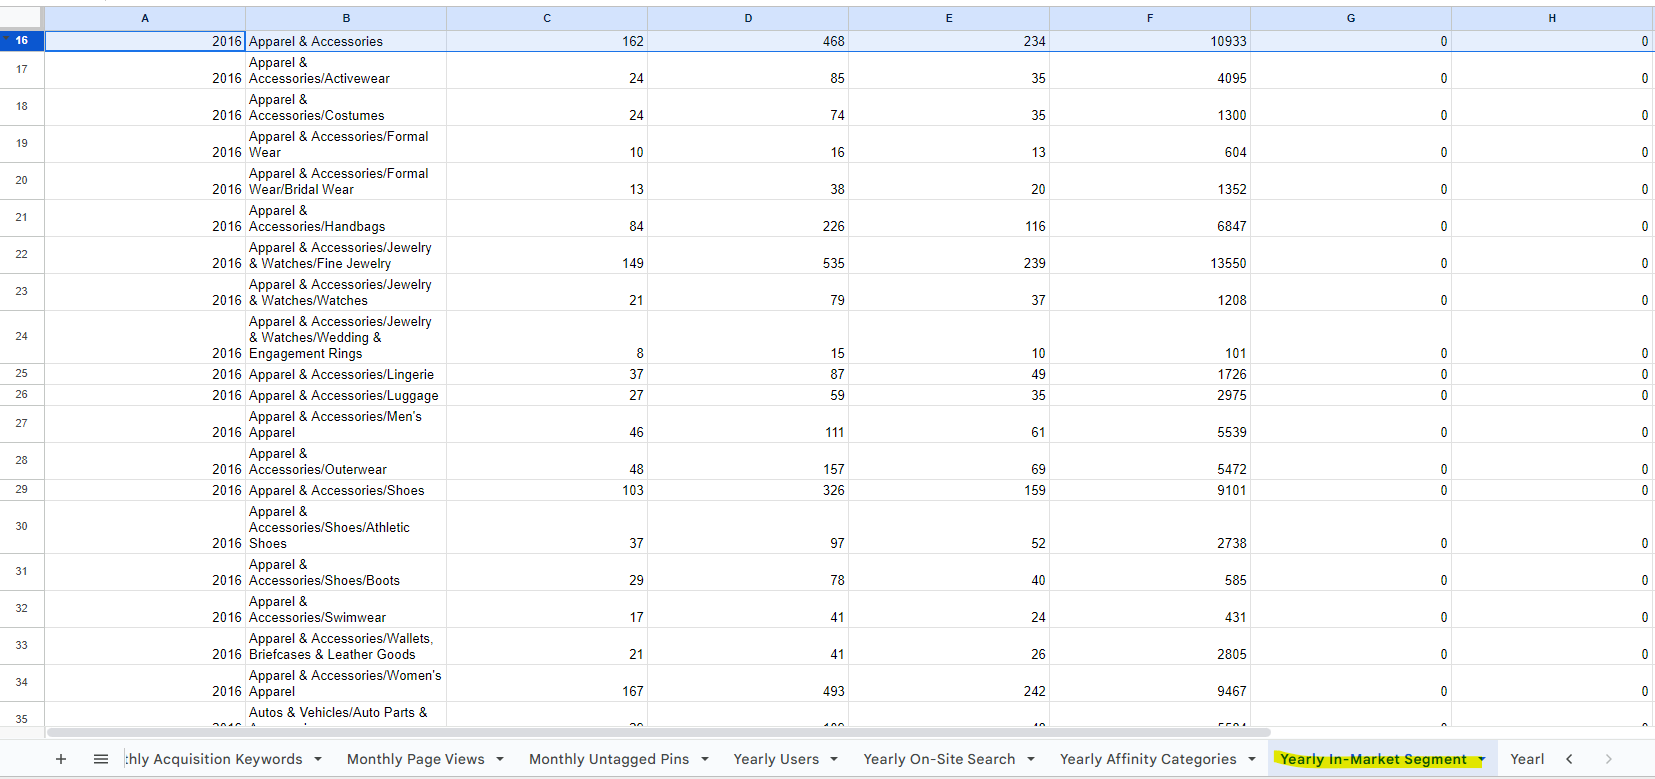
The backup will be saved in a series of spreadsheets, so your data will look like this:
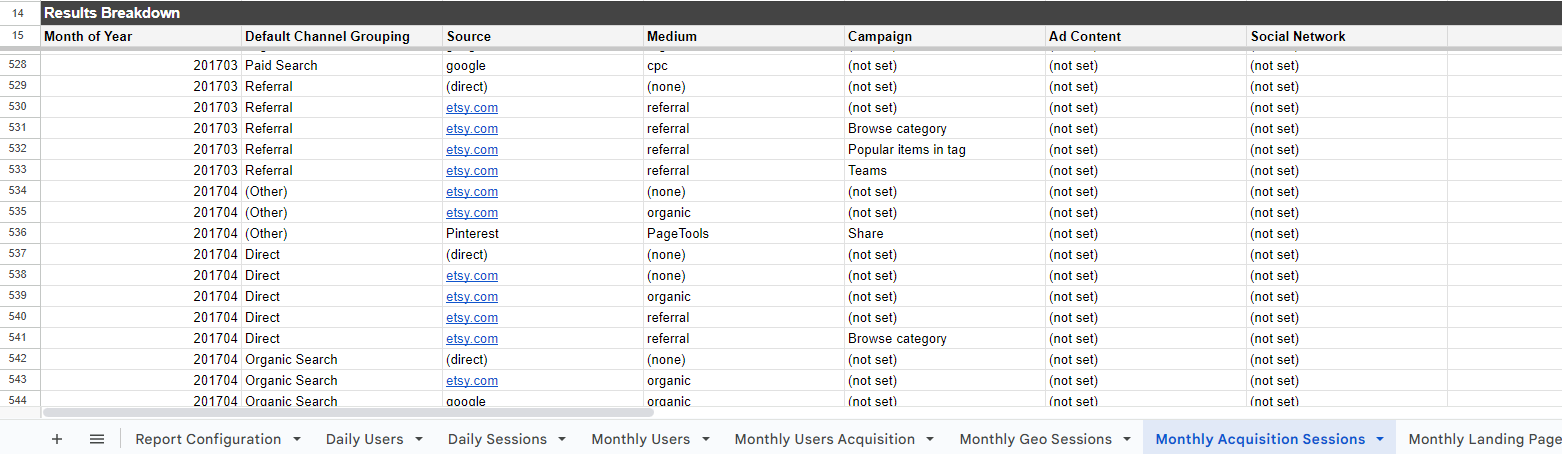
Once your data is in the spreadsheet, you can start doing other stuff with it, like making charts to understand it better.
So let’s get started…
1. Install the Google Analytics add-on for Google Sheets
You will need to be logged into Google for all the next steps, using the same Google account you use to access Google Analytics.
On the add-on page, click the blue “Install” button and follow the prompts to allow it access to your account. It needs this to work and save your data to the sheet.
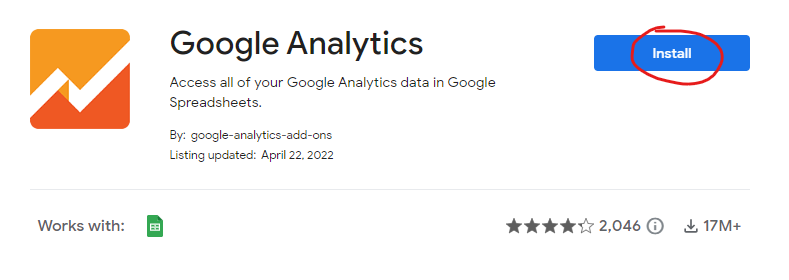
Once installed, you’ll be able to use this add-on with any Google Sheets document, including the backup tool you’re about to access!
2. Get the Google Sheets backup tool
Make a copy in Google Sheets: File > Make a copy. (It will be saved to your “My Drive”.)
For more help making a copy, see the Google Sheets Help website.
Multiple shops or websites
To back up more than one Google Analytics View (eg. multiple shops or if you’re using it for a different website too, like your Shopify site), make a copy for each View.
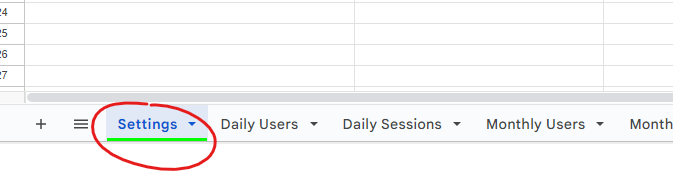
3. Complete the Settings for the backup tool
The first tab of the backup tool (“Settings”) is the only place you need to be. You’ll enter some details about the Google Analytics View you’re backing up, then it will tell you when you’re ready to backup and if the backup was successful.
You will want to backup the data from your “All Web Site Data” View. If you made a Raw Data or Test view, there’s no real point to backing up that data now unless you think the numbers in your “All Web site Data” View were wrong in some major way.
1. Open the Google Analytics account you want to backup
2. Go to Admin > All Web Site Data View > View Settings
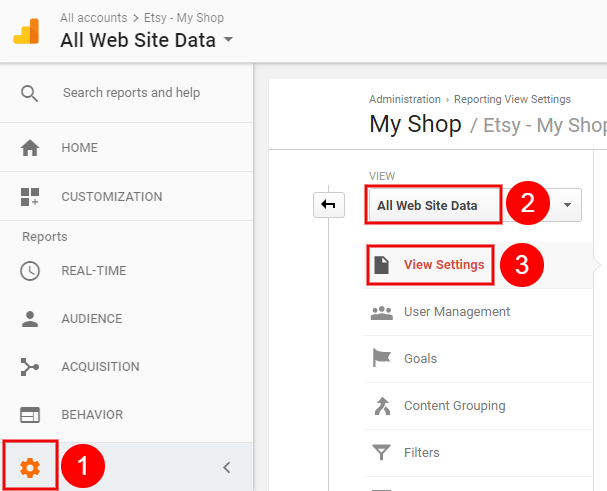
3. Copy the View ID at the top of the page
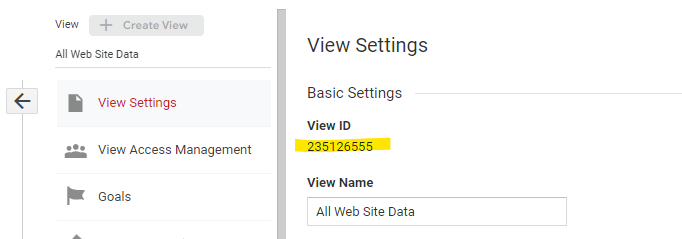
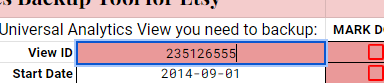
4. Paste that number into the View ID setting of the spreadsheet
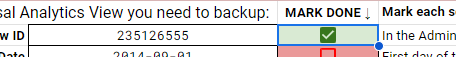
5. Mark that Setting as “Done”!
The Start Date should be on or before you installed Google Analytics.
If you aren’t sure, you can either check in your reports how far back the data goes or simply choose a date just before you opened your shop! There is no problem at all with setting a date when you had no data – the rows will just be empty.
The End Date should be after your account stopped recording data in Universal Analytics.
If you aren’t sure, leave the default, which is 31 December 2023. By this date, all Universal Analytics properties had definitely stopped recording data!
This backup tool is configured to capture a lot of the “special Etsy stuff” I’ve helped you configure over the years. But it will work for a non-Etsy shop too! Just untick this box to turn off some Etsy-only backup settings.
If you have Ecommerce Tracking turned on, like with a Shopify site, this sheet will only backup the very basic ecommerce data of “Number of Transactions” and “Revenue”. It WILL NOT back up things like product names, categories, add-to-carts etc.
If you have a website with full Ecommerce Tracking and can afford it (it’s 99 bucks), I suggest using the Analytics Canvas UA Backup Service instead!
Did you setup my recommended Engagement Rate Goals?
YES: Follow these instructions to create a new Calculated Metric that adds up the raw Engagement count
This is DIFFERENT to the Calculated Metric in the original instructions! A simple engagement count, rather than the % rate, is more useful when we backup the data to a spreadsheet. We can calculate the engagement rate as a percentage again later.
Calculated Metrics work retroactively, so you can do this now as long as the goals already exist.
1. Go to Admin > All Web Site Data View > Calculated Metrics > [ + New Calculated Metric ]
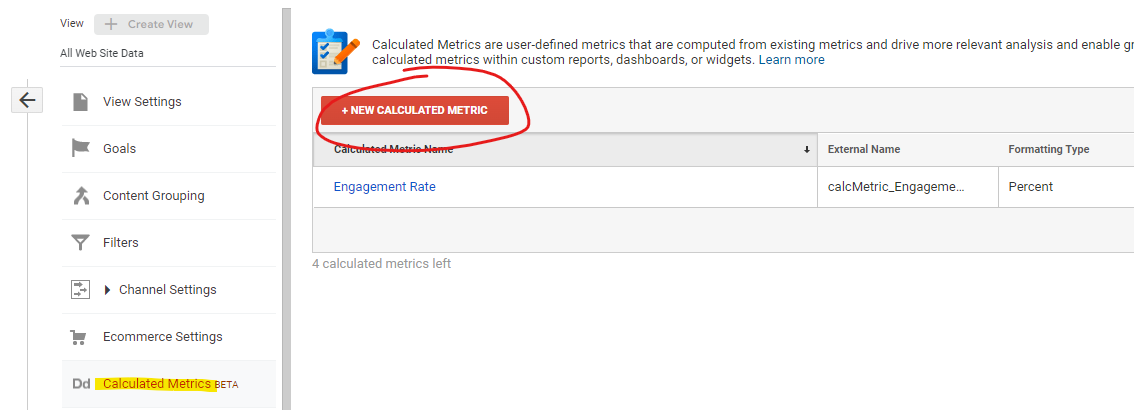
2. Call the new metric “Engagements” with the formatting Type “Integer“
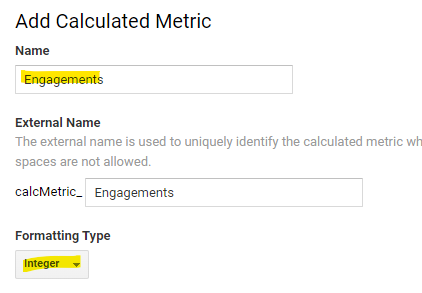
3. Enter the following Formula:
{{Engagement - Many pages (Goal 1 Completions)}} + {{Engagement - A few pages (Goal 2 Completions)}} + {{Engagement - Long visits (Goal 3 Completions)}} + {{Engagement - Interested visits (Goal 4 Completions)}}
If you have ever created other goals, your Goal numbers might be different! I suggest typing the formula in manually by typing “Engagement” into the field, then selecting the four “Goal Completions” metrics for the four engagement goals. Put a simple “+” sign between them to add them all up!
4. Save your metric
It will work straight away, and you can edit it at any time if you make a mistake.
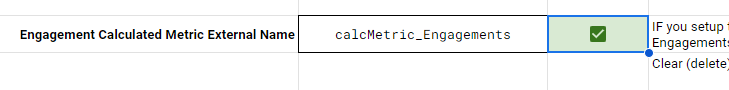
5. Mark the Setting as “Done”
If you followed the instructions, you won’t need to change the default “External Name”.
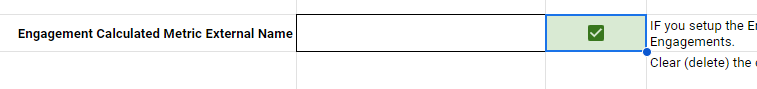
NO: It’s too late to set up the goals now. They don’t work retroactively 🙁
Delete the metric name out of the cell and mark that Setting as “Done”
4. Run the backup reports
When all your Settings are done and checked, the spreadsheet will tell you it’s OK to run your reports!
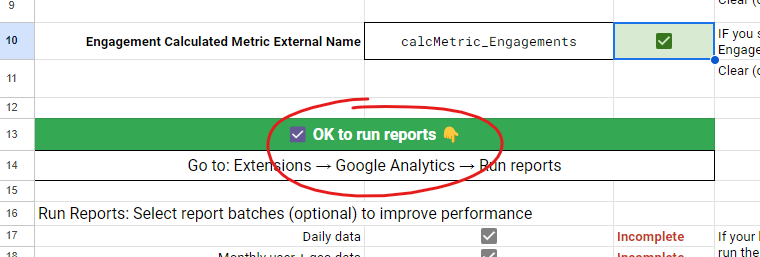
Go to Extensions > Google Analytics > Run reports
You will see a confirmation box that backup reports have run
The backup might take some time!
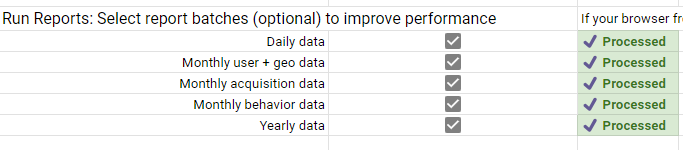
If your browser freezes or you want to play it safe, you can run the reports in “batches” instead.
Untick all the batches, leaving only ONE ticked. Then choose “Run reports” again. If the chosen reports complete successfully, repeat the process for each of the remaining batches.
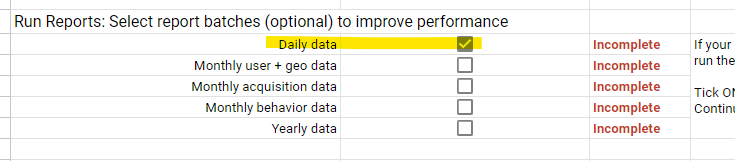
TIP: You can safely run a report multiple times!
5. When all backup reports are complete…
The Settings tab will tell you when all the backup reports have saved:
Double-check the data has saved
Click through the spreadsheet tabs and make sure data appears in each one. You don’t necessarily need to check if it’s accurate, as long as something is there and it looks like enough to represent the date range you put in.
How to use the backups
First, breathe a sigh of relief.
Your key data is saved and safe, in your own Google Drive account. Your Universal Analytics account can be deleted tomorrow and you will still have access to historical traffic trends, keyword history, year-on-year comparison data and other good stuff!
There are now two ways you can use this backup data.
1. Build your own dashboard
You can add visualisation charts directly into Google Sheets or use the super-powerful tool, Google Looker Studio.
Here are some resources to get you started with Looker Studio:
- Looker Studio Quick start guide from Google
- Google Looker Studio Tutorial from MeasureSchool (Free)
- Looker Studio Complete Advanced Tutorial on Udemy (Paid)
- Welcome To Looker Studio ebook from OptimizeSmart (Free)
- How to use [Looker Studio] with Google Sheets
- Looker Studio tutorial for Google Analytics 4 [VIDEO] from Analytics Mania
2. Use my pre-built Google Looker Studio Dashboard that works perfectly with these backups
I am developing a comprehensive dashboard that will perfectly display the data I have selected for you to backup. It will approximately follow the structure of my original “Google Analytics for Etsy” ebook, including the custom reports!
The dashboard template will be available for purchase in the coming weeks at a very affordable price.
Backup your data now so your reports are ready to link to the dashboard!
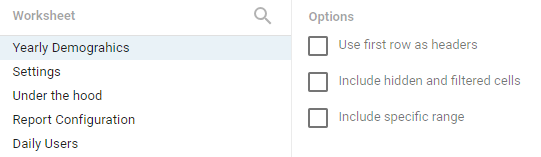
Why are the column headings missing from the backup?
They aren’t! I have hidden the first bunch of rows from the backup because it makes it a lot easier to use the backup report in Google Looker Studio.
This means that those who choose to use my pre-built Google Looker Studio dashboard do not need to change the backup spreadsheet at all.
You only need to “show” these rows if you:
1. Want to create your own Looker Studio dashboard
You’ll need to view the column headings of each backup report temporarily while you create your own Data Sources in Looker Studio, so you know what to name each field.
Tip: here are the best settings to use these backups in Looker Studio!
2. Need to use the data in a different way
Once your data is backed up into a spreadsheet, it’s completely yours to use however you like! You might want to simply use Google Sheets charts or do something else entirely.
Whatever your plan, make sure you run those backup reports by June 30, 2024 or it will be too late!
Get notified when the Looker Studio Dashboard is available
Enter your email address to get an email when the Artisan Analytics Looker Studio Dashboard template is available for purchase, to use with the backups you create. I might also send you other email updates about the Universal Analytics backup tool or related services, but you can unsubscribe at any time.
Done-for-you (skip the instructions!)
I can run the backup and simply hand the data back to you! You don’t need to install the add-on, track down View IDs or worry about “batches” (what!?) – just add me to your account and leave it with me.
INCLUDES a free copy of the Looker Studio Dashboard once available!
If you have an Artisan Analytics PRO account, please login first or continue your purchase here.