Not all traffic is equal. It’s incredibly important to be able to identify valuable visitors.
Visits that lead to sales.
Unfortunately, you can’t track Etsy sales in Google Analytics right now, but that doesn’t mean you can’t have conversion rates. I’m not talking purchase conversions here (sales) but goals that imply something good: engagement, getting-close-to-the-sale-ness. Then you can say what percentage of your visits met this criteria, and whether some traffic sources, products etc. performed better than others.
Let’s call this an Engagement Rate!
IMPORTANT: These instructions are for Universal Analytics. Google Analytics 4 comes with built-in Engagement and Engagement Rate metrics that measure roughly the same visitor behaviour – yay!
What’s an Engagement Rate?
An Engagement Rate is a “proxy metric” in that we assume it indicates certain things that we otherwise can’t track. In this case, it’s indicating interest in your store and products, which has a better chance of leading to sales.
What if you could see this, for your store?

So it looks like there’s a lot of internal Etsy search traffic (that’s hardly surprising) but how valuable is this traffic? The Engagement Rate is one way to find out.
Defining “engagement”
I’ve defined this Engagement Rate using two standard metrics:
- Session duration
- Pages per session
Each of these metrics has two “thresholds” of engagement: levels where I’ve decided that this particular visitor is more interested than the average visitor. When one of these thresholds is reached, it counts as a conversion. One visit can convert up to 4 times if it hits both thresholds for both metrics!
Google Analytics uses goals to track important actions as conversions. So that’s what we’ll use to track when visits reach our four “engagement thresholds”.
The Engagement Rate is just the conversion rate for all four goals, added together.
What is “Engaged” for your shop?
We’re going to use some Advanced Segments to find out what our existing averages are for Pages / Session and Session Duration.
TIP: Use your original All Web Site Data view for this part, then add your Goals to your Test View (for now).
1. Set an extended date range of 3 – 6 months.

2. Open the Audience Overview report
3. Click “Add Segment” to apply two Advanced Segments:

- Select the default “Non-bounce Sessions” segment (it’ll be in the list already).
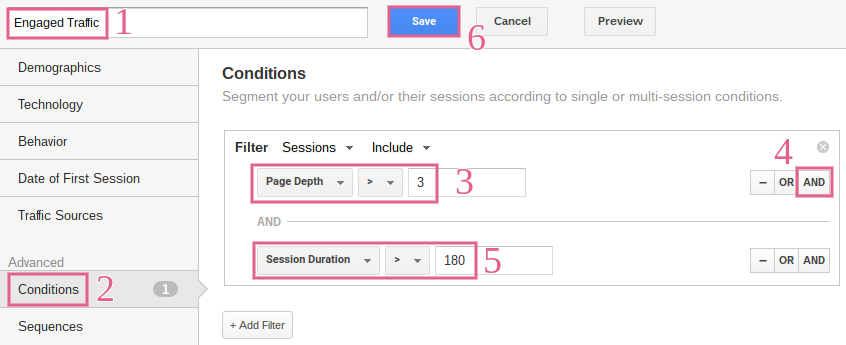
- Create an “Engaged Traffic” segment. Click the red “New Segment” button to create one with the following conditions:

(Yes, that “Session Duration” is in seconds!)
4. Click “Apply”
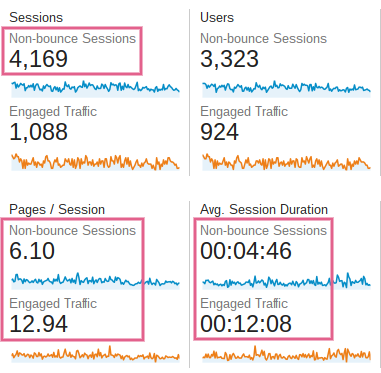
Have a look through the metrics below the line graph. Everything we need is right there!

5. Check that you have at least 3,000 sessions in the “Non-bounce Sessions” segment. If not, increase your date range until you hit 3,000 or reach the date you first connected GA. If you can’t reach 3,000, keep following along but check your numbers again once a month.
5. Write down these numbers:
- Pages/Session for Non-bounce Sessions
- Pages/Session for Engaged Traffic
- Session Duration for Non-bounce Sessions
- Session Duration for Engaged Traffic
These four numbers will form the basis of our four engagement thresholds, but we’ll tweak them a little as we create the goals.
Create your “engagement goals”
SHORTCUT! Install these goals from a template then keep reading to find out how to configure them for your own shop.
Head to Admin > Test View > Goals
For each of the following goals, click the red “New Goal” button and enter the details as I describe them.
1. Engagement – A few pages
- Goal setup = “Custom”
- Name = “Engagement – A few pages”
- Type = “Pages/Screens per session”
- Continue to Goal details…
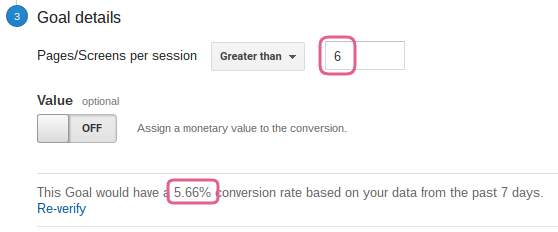
Take your “Pages/Session for Non-bounce Sessions” number that you just recorded. Round it down to the nearest whole number and enter that as the value in “Goal details”.
Now click “Verify this Goal” to check the conversion rate. It should be between 5 – 10%. If it’s too big, it won’t mean anything! If the conversion rate is much too big or small, adjust the number slightly. You must use a whole number.

“Save” when you’re done!
You can adjust these goals over time as you improve your store (and therefore increase your conversion rate!), but I strongly recommend not touching them more than once every three months.
2. Engagement – Many pages
- Goal setup = “Custom”
- Name = “Engagement – Many pages”
- Type = “Pages/Screens per session”
- Continue to Goal details…
Enter your “Pages/Session for Engaged Traffic” as the value. Again, round down and aim for under 5% conversion rate when you verify.
3. Engagement – Interested visits
- Goal setup = “Custom”
- Name = “Engagement – Interested visits”
- Type = “Duration”
- Continue to Goal details…
Enter your “Session Duration for Non-bounce Sessions” as the value, including both minutes and seconds (or round to the nearest whole minute). This conversion rate should be between 5 – 10%.
4. Engagement – Long visits
- Goal setup = “Custom”
- Name = “Engagement – Long visits”
- Type = “Duration”
- Continue to Goal details…
Enter your “Session Duration for Engaged Traffic” as the value. This conversion rate should be under 5%.
Your goals will only start recording conversions from when you first create them.
Create an “Engagement Rate”
Once you’ve created your goals and waited for some conversions to be recorded, you can use the “All Goals” conversion rate as the overarching Engagement Rate. This is convenient because it’s available in every standard report.

But what if you want to create some other goals? Won’t the conversion rate for those goals get included and ruin the Engagement Rate?
Yep!
Instead, we can calculate our own Engagement Rate that will only ever use the four “engagement goals” we just created.
Calculate the Engagement Rate
Head to Admin > Test View > Calculated Metrics
Click the red “New Calculated Metric” button and call it “Engagement Rate”.
Choose the “Percent” Formatting Type.
Enter your formula like this:
( {{Goal 1 Completions}} + {{Goal 2 Completions}} + {{Goal 3 Completions}} + {{Goal 4 Completions}} ) / {{Sessions}}
Your actual formula will depend on your goal IDs and Sets, but if you begin to type “Engagement”, you’ll see them as options. Make sure to choose the “Goal Completions” metrics from the list.
Here’s what mine looks like:
( {{Engagement - Interested visits (Goal 6 Completions)}} + {{Engagement - Long visits (Goal 7 Completions)}} + {{Engagement - A few pages (Goal 8 Completions)}} + {{Engagement - Many pages (Goal 10 Completions)}} ) / {{Sessions}}
Yours will look extremely similar, just with different ID numbers for each Goal.
Save your metric. It will work straight away, and you can edit it at any time if you make a mistake.
For now, this metric will show the same conversion rate as “All Goals Conversion Rate”, but if you ever add other goals, this calculated metric will let you continue to show your combined engagement rate separately from your other goal conversion rates.
Use your Engagement Rate
Where to see your Engagement Rate metric
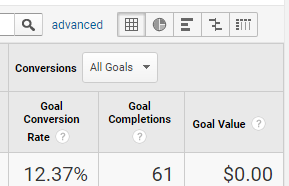
In standard reports, use the “All Goals” Conversion Rate (far-right columns). This will be the Engagement Rate as long as you don’t create any new Goals or don’t already have any in place.

Dashboards and custom reports can use the calculated metric Engagement Rate, which will always be correct even if you add new Goals.
What kind of Engagement Rates should I see?
This Engagement Rate can hit up to 400% for individual sessions, because it simply adds the conversion rate of each of the 4 engagement goals. If you’re looking at super-high conversion rates like this, though, you’re either doing amazingly well (and might need to adjust your goal thresholds) or the number of sessions you’re looking at is too small for meaningful analysis.
When you were setting up your goals, you used the “Verify” feature to adjust the threshold so you were seeing below or above 5%, which is a fair conversion rate for a non-sales action. In this case, “being interested”. Across different types of visitors, coming from different places, you’ll see your rates vary from well below 5% to getting close to 50%!
So, do they love me?
This Engagement Rate is an indicator. It’s just one extra bit of information about your visitors. All it does is tell you what percentage of visitors viewed a lot of pages or stayed for a while.
It’s up to you how you interpret that information.
It seems reasonable to assume that people who show more interest in your shop are closer to buying, but there may also be people buying your items on impulse, without looking around first. You need to watch how your sales and these Engagement Rates match up (if possible).
You should also keep in mind that this metric is easily influenced by individual visitors who complete all four goals. Any segment will be more likely to show a higher engagement rate as the sessions involved reduce. For example, in my report at the start of this post, it’s not surprising that Etsy search traffic, with > 2,000 sessions, had a lower engagement rate than Google AdWords, with only 139 sessions.
The more sessions included in the segment you’re looking at, the more accurate the engagement rate will be.
But once you’re happy that you understand how this metric – how it’s calculated, it’s limitations, what it means – you can use it to begin to put more value on certain traffic sources, visitor segments, search keywords, and more!
So set up your Engagement Rate now and stay tuned for more suggestions on how to use it.

Comments (3)
Hi There, I can’t seem to find unbounced users…I can only find All users (that’s the default)
Also, for some reason my Age demographic tracking was working until about mid-December then all of a suddent stopped.
Hi Pamela,
I had this problem too until I realised that you have to create 2 segments. The first one is your non-bounce session where you Select the default “Non-bounce Sessions” segment from the list, then hit apply button at the bottom. I DID NOT HIT APPLY the first time that was my mistake that’s why I could only see one segment.
Then Follow the rest of the instructions to create the second segment starting at:
Create an “Engaged Traffic” segment. Click the red “New Segment” button to create one with the following conditions:
When you are finished you should see 2 segments at the top of your page Non-bounce Sessions and Engaged Traffic
Hope this helps