On Some time after 1 July 2023, Google Analytics Universal Analytics (UA) stopped recording data.
The future is Google Analytics 4. Well, maybe it’s GDPR-friendly analytics instead. But it’s certainly not the same tool we’ve used for all these years (decades?) and it’s not the same set of data.
What do we do with all the data in our Universal Analytics Properties? Can we backup our analytics data? Can we transfer UA data to GA4? Can we continue to analyse it at all?? Is it only an option for big business (i.e. comes with a hefty price tag) or is it something boutique ecommerce shop owners can DIY?
We only have until July 2024 to figure this out, when Google will actually delete all our Universal Analytics properties and reports.
Transmission from July 2024…
It happened. It’s done. It’s gone.
If you got some backup data, fantastic! If you used my backup tool for Etsy, grab the Looker Studio Dashboard to explore it.
If you missed the window, don’t worry. Let’s look forward and make sure your shop is connected to Google Analytics 4 instead.
What’s Google’s plan? Will my Universal Analytics data actually be deleted?
Yes! Your Universal Analytics properties, views, data, custom reports – everything! – will be deleted from Google’s servers on 1 July 2024.
Can we just… move Universal Analytics data to GA4?
Simply put: no.
There is no way to move your data from UA to GA4. The data structure is totally different so they don’t “fit” into the same kinds of reports. It’s a square-peg-round-hole situation. To us, a lot of the dimensions and metrics look the same but they’re calculated and stored quite differently “under the hood”.
Backup or archive your Google Analytics Universal Analytics data
You can use more than one method! Some of these are more technical than others. You can absolutely start with the easiest one and take a few quick backups now, then come back and try a more complex & complete backup method later. As long as it’s before 1 July 2024!
The pre-configured backup method for Etsy shops

Backup your Etsy shop’s old Google Analytics data for free
Left it to the last minute to save your Etsy shop’s old Google Analytics data? If you’re here, then yes: you have. The countdown is on to 1 July 2024 when all our Universal Analytics data will be deleted! Transmission from July 2024… It happened. It’s done. It’s gone. If you got some backup data,…
The fast, free & easy backup for any website
If you are time, cash and tech-confidence poor, this is the option to start with.
Pros: No new tools to learn. Exports the reports you already use in Google Analytics.
Cons: Not very flexible – what you export is what you get. You can’t do more segmentation or drilldowns later.
Backup the data
First: Open your Google Analytics UA Property > All Web Site Data view
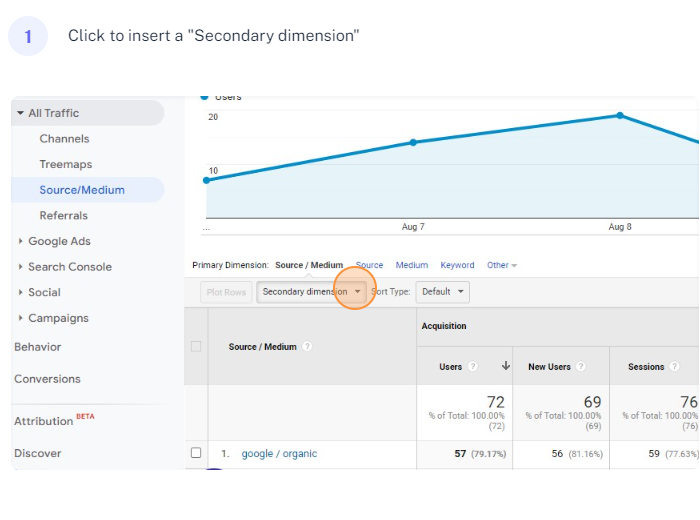
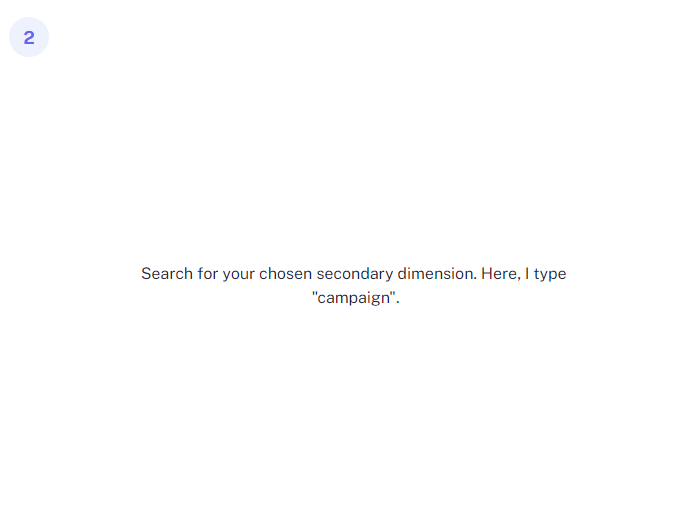
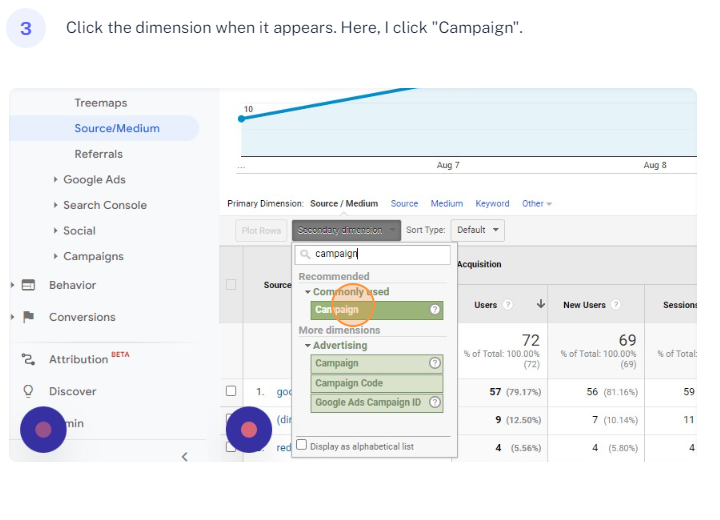
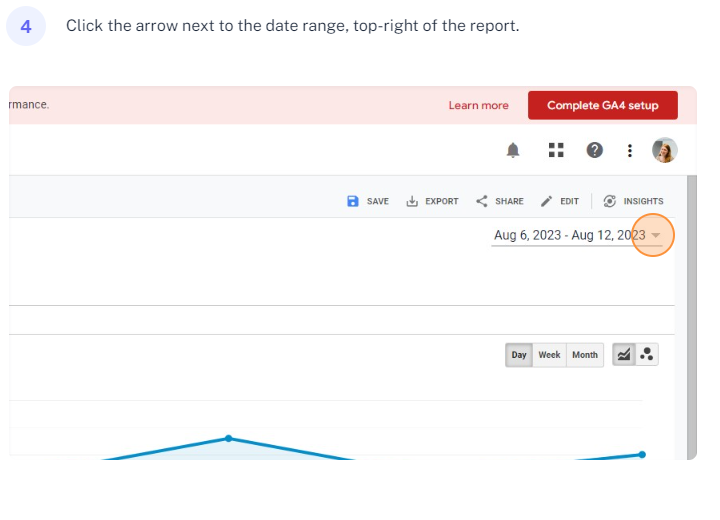
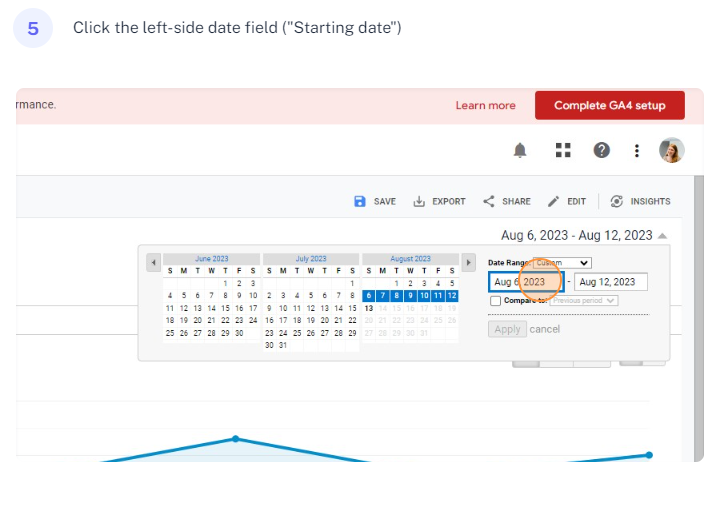
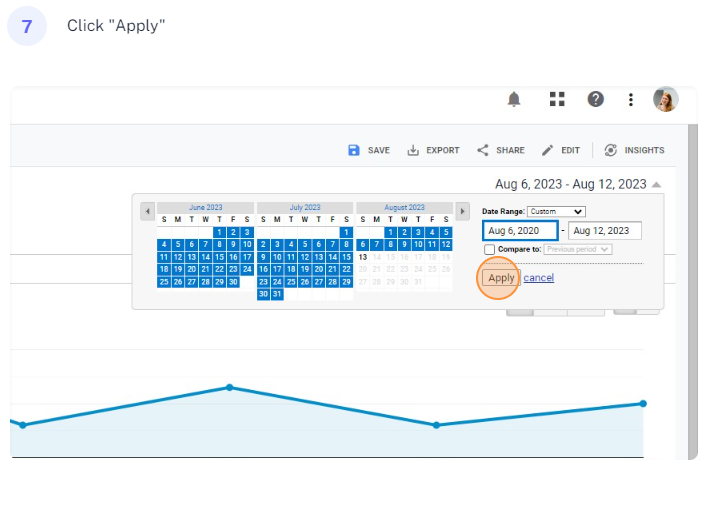
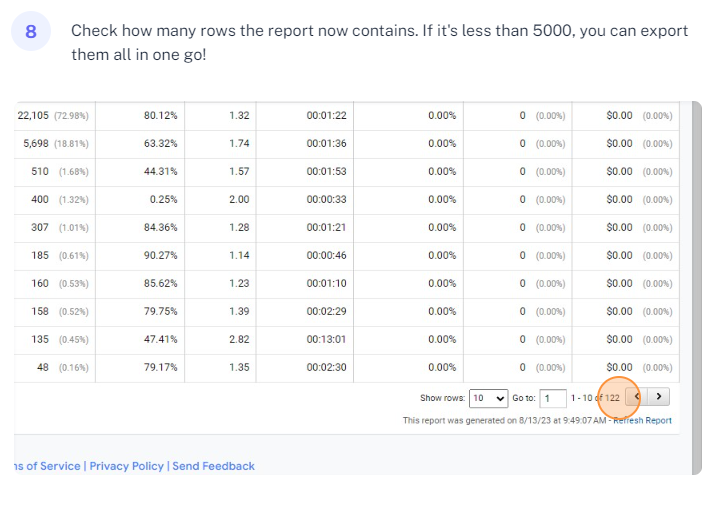
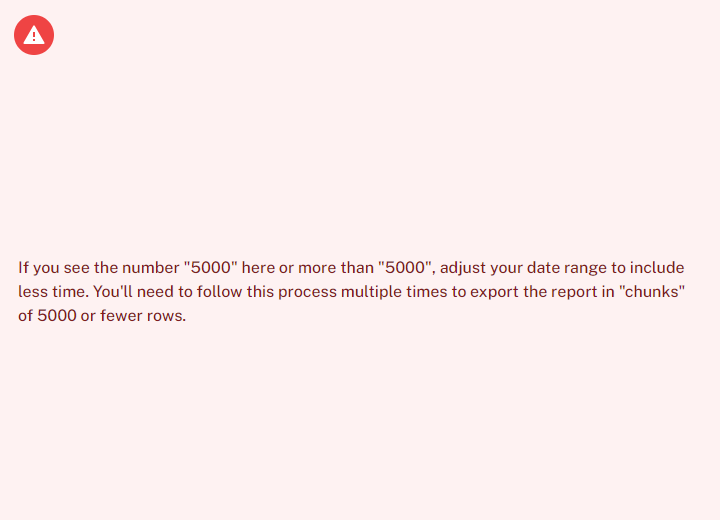
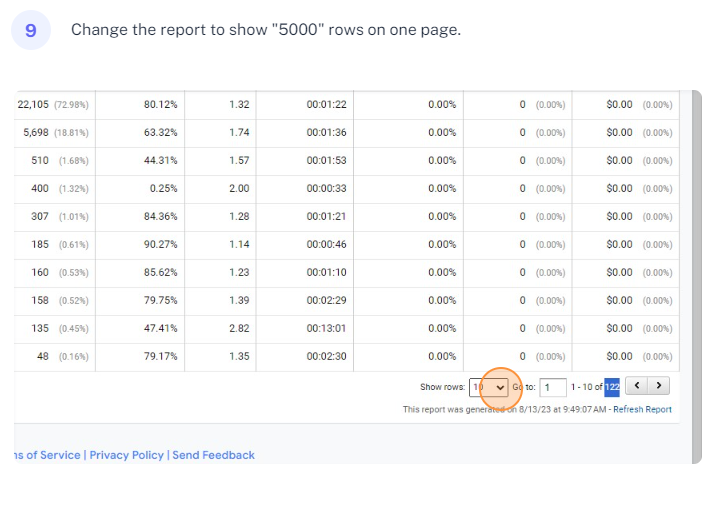
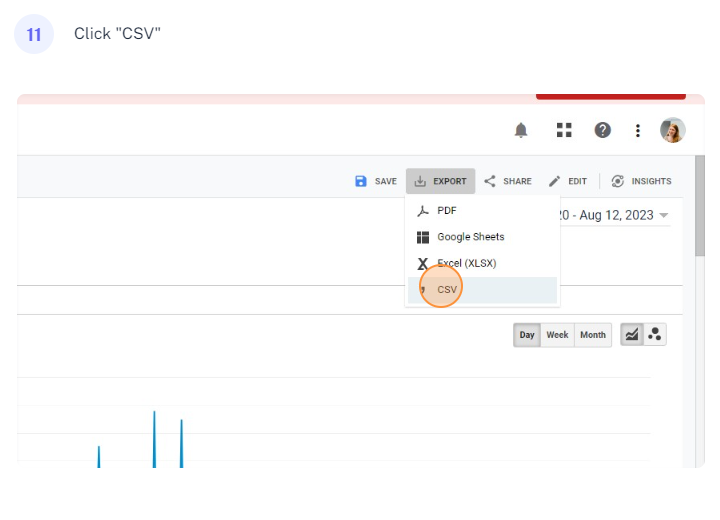
Then: Open each of the reports you already regularly use and follow these steps:

The “99 bucks for the works” backup tool (NOW CLOSED)
This option is now closed as the deadline fast approaches. There is no longer time to process a backup through Analytics Canvas.
Analytics Canvas have created a tool that can do all the exports for you and capture a whole lot more data. It’s only 99 USD per UA View (i.e. your All Web Site Data View) as long as it’s under 10 million rows total, which… your site will be.
Pros:
- Includes a lot more dimensions and metrics in a single report than the in-built GA reports.
- If your shop makes money, $99 to get all your GA exports is not much.
- You don’t need to think of all the data you need straight away. Once you’ve paid for your 10 million rows, you can keep going back in and exporting more when you need the data (until 1 July 2024) until you hit your limit.
- Export straight to Google Sheets so it’s super easy to pull your old data into a Google Looker Studio (Data Studio) dashboard. Or buy their extra package to get a comprehensive dashboard included.
Cons:
- No longer available
- A little bit technical. You should have a fair understanding of the GA UA concepts (like dimensions, metrics, segments etc) to understand the options.
- It’s an extra $100 USD for their pre-built Looker Studio dashboard that works with the backups. Personally, I think this is an add-on well worth the price but it is an extra on top of the 99 bucks.
The in-between backup method
If you want more data than in-built reports but don’t want to fork out $99, you can DIY the more complex reports straight into Google Sheets with the Google Analytics Spreadsheet Add-on.
- Install the addon in the Google Workspace Marketplace.
- Follow getting-started instructions from Digital Astronaut and Search Engine Journal.
- Get more detailed documentation from Google.
If you think your historical GA data is so useful that you need more than the in-built reports saved-to-CSV, then I suggest they’re worth $99 to you so you can spend your time on something else. But some people just enjoy DIY-ing things like this. If that’s you, then have at it!
How to use your backups
No matter which method you use* to backup your Universal Analytics data, you’ll end up with a bunch of spreadsheets: CSVs, Excel or Google Sheets.
* Unless you export straight to BigQuery via Analytics Canvas, but you don’t need my help if you’ve managed this.
Use Google Looker Studio
The best way to use this data will be visualise it in Google Looker Studio (previously called Data Studio). Using this tool, you can show your UA data side-by-side with your current GA4 data using the native Looker Studio integration.
Here are some resources to get you started:
- Looker Studio Quick start guide from Google
- Google Looker Studio Tutorial from MeasureSchool (Free)
- Looker Studio Complete Advanced Tutorial on Udemy (Paid)
- Welcome To Looker Studio ebook from OptimizeSmart (Free)
- How to use [Looker Studio] with Google Sheets
(Tip: Upload your CSVs to Google Drive and convert them to Google Sheets so you can use the Google Sheets connector, which is much easier to maintain than adding the CSVs to Looker Studio directly.) - Looker Studio tutorial for Google Analytics 4 [VIDEO] from Analytics Mania