This report contains the physical location of your visitors, based on their IP address. It shows continents, countries, states/regions and cities.
Why this info can be useful
Knowing how your visitors break down across countries and regions can let you make decisions around:
- Identifying untapped markets.
- Where you should target retail shops.
- Whether you should address the changing seasons in the opposite hemisphere in your collections and marketing.
Open this report!
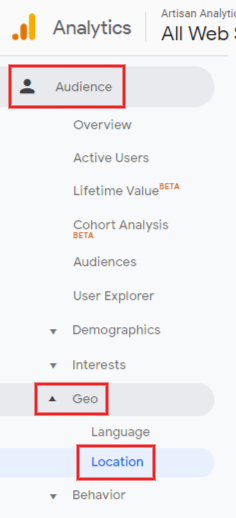
Access it under:
AUDIENCE > Geo > Location
Report Walk-through
How accurate is the geo data?
Google Analytics collects the location data based on each visitor’s IP address: a unique code to identify each internet connection.
How accurate this is depends on how that person is connecting to the internet. In the vast majority of cases, the country and region (state) will be accurate. In the United States, the city is also quite accurate for many visitors.
In other countries, the city can be quite unreliable and is just where the internet provider (ISP) is based.
Mobile connections are very accurate. Satellite internet can be very inaccurate!
Tips:
- Try to use the broadest type of geo data you can get away with. For example, using Continent (instead of country) to decide how many visitors are in the southern or northern hemisphere.
- How much you rely on this geo data should depend on what you already know about your visitors & customers and what kind of decisions you need to make.
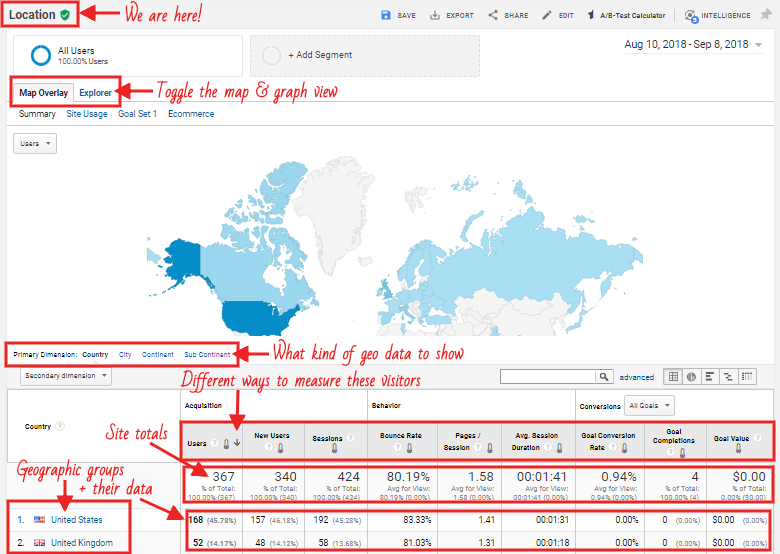
About the Numbers: different ways to measure these visitors
So what do all these numbers really mean?
Users
We often call “users” in Google Analytics “visitors”, which suggests we’re talking about individual people. But it’s rarely that simple. A Google Analytics User is one “cookie ID”, and one human can use your site with many different Google Analytics cookie IDs, for a few reasons. Cookies are stored in your browser, so each browser and device will have a different cookie ID and show as a separate User.
A visitor who opens your shop on her laptop, then on her mobile phone, will count as TWO separate users.
A shared computer used by two different people who both visit your shop, could count as ONE user.
Personally, I like to think of Users as “People… mostly”. Your true visitor count is likely to be slightly less than the number you see here.
New Users
Users who visited your shop for the first time within the dates you have selected, even if they then go on to visit multiple times.
Sessions
Visits: the number of different times they opened your shop website.
“Sessions” reset at midnight (your time), after 30 minutes of inactivity and if that person returns to your site a different way (eg. clicks a link in an email, then does a Google search and comes back again). (More info on Analytics Help.)
Bounce Rate
The percentage of sessions that only included ONE page. They looked; they shrugged; they bounced.
It’s not always totally bad but can often be improved.
Pages / Session
The average number of pages these visitors viewed in each of these sessions. This is a fantastic engagement metric, because it’s extremely reliable! But it can easily be skewed by a one or two people who view every single product in your entire shop and push up your average.
Don’t worry, you’ll learn how to watch out for that 🙂
Avg. Session Duration
The average length of time between the first and last page view in each of these sessions.
Careful – this is not a perfect measure of the time they spent! In fact, Session Duration is only measured and updated when a page loads, by deducting the time the previous page loaded. For example:
- Page A loads at 9:15am + 20 seconds. No Session Duration yet recorded as this is the first page!
- Page B loads at 9:15am + 30 seconds. Session Duration = 30-20 = 10 seconds (so far).
If Page B was never loaded – and this person bounced – then the Session Duration would still be 00:00:00. Zero.
If Page B is the last page they view, then the total Session Duration is still 10 seconds, no matter how long they spend on Page B.
Rows with 100% Bounce Rate will always show 00:00:00 Avg. Session Duration.
Goal Conversion Rate, Completions & Value
These columns indicate whether your visitors are doing what you want them to: filling out forms, signing up to your newsletter etc.
If you can connect your ecommerce system to Google Analytics, then this is also where you’ll see Transactions and Revenue!